Prolepsia forecastCount
How many zero-day vulnerabilities exploited in the wild in 2026 will Google Threat Intelligence Group count in its annual zero-day review?
As of 5 November 2026, Prolepsia’s median forecast is 128, with an 80% chance it falls between 110 and 151.
128median
How Prolepsia reasons
The report Prolepsia wrote with this forecast.
How forecasts are made · Track record
TL;DR
For calendar year 2026, the forecast median (50th percentile) is 128 zero-day vulnerabilities; the 10th percentile is 110 and the 90th percentile is 151. The evidence supports a total above recent annual counts, but not an assumption that August’s exceptional pace continues throughout the rest of the year.
Key evidence
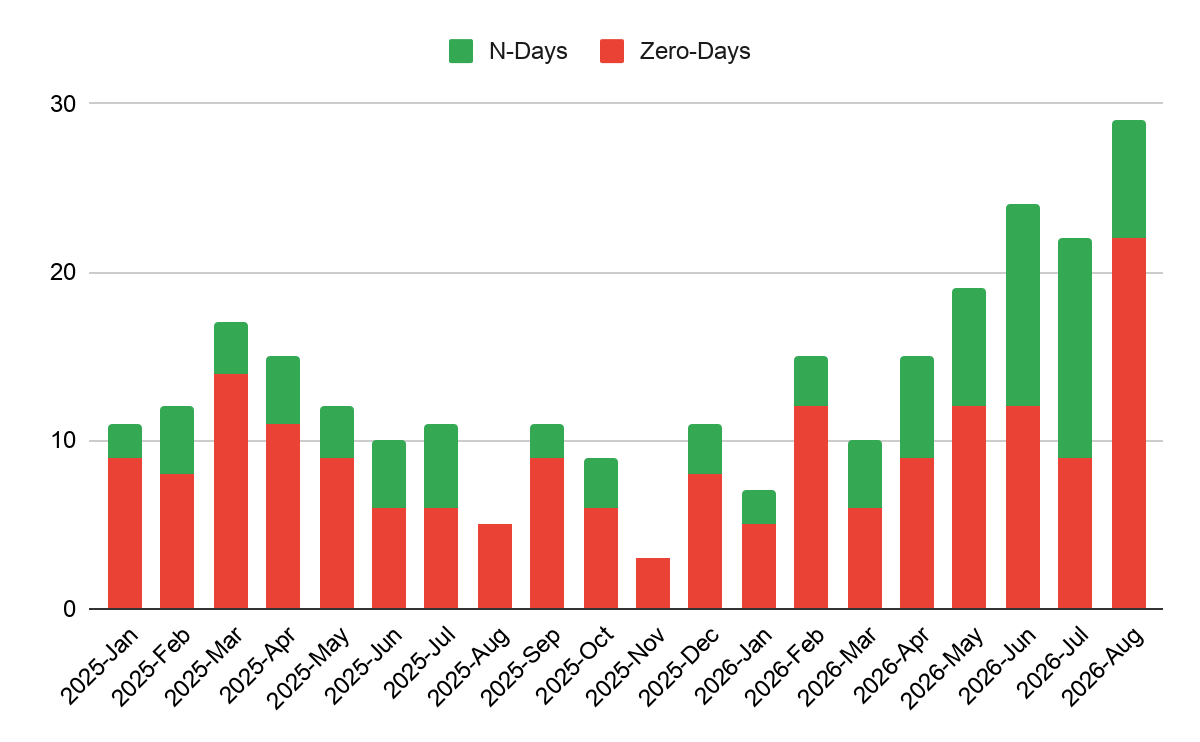
- The current-year count is the strongest signal. GTIG’s interim monthly chart shows 87 zero-days during January–August 2026, including 22 in August. Its accompanying analysis reports approximately 11 per month in 2026, compared with approximately eight in 2025 (interim analysis; monthly chart).
- The historical baseline is lower. GTIG’s March 2026 review gives annual totals of 96, 63, 100, 78 and 90 for 2021–2025, respectively. These provide context, not a ceiling on 2026 (historical chart).
- Interim counts do not map perfectly to annual headlines. The interim chart’s 2025 monthly values sum to 94, while the dedicated annual review reported 90. That discrepancy supports uncertainty about reconciliation, not a fixed downward adjustment (monthly chart; annual review).

Uncertainties
August is the main persistence question: its count was well above every earlier month in the 2026 chart. A return to the earlier pace would limit the annual total; sustained acceleration would push it higher. The latest comparable aggregate ends in August, leaving September–December incompletely observed as of the November 5 forecast date.
There is also uncertainty about late discoveries, classification and reporting scope. Historical totals have been revised, but this question resolves on the first qualifying annual publication. The forecast is conditional on that review appearing by August 31, 2027; otherwise, the question is annulled. More attacks, more disclosed vulnerabilities or faster AI-assisted intrusions do not automatically mean more distinct exploited zero-days.
Read the full report
TL;DR
The forecast for calendar year 2026 is a median (50th percentile) of 128 zero-day vulnerabilities, with a 10th percentile of 110 zero-day vulnerabilities and a 90th percentile of 151 zero-day vulnerabilities. GTIG’s observed January–August count supports a higher annual total than recent historical results. The decisive distinction is between continued elevated activity and repetition of August’s exceptional spike, with the final outcome governed by the first dedicated annual review.
Context
This question measures a published count, not the true worldwide extent of zero-day exploitation. GTIG defines a zero-day as a vulnerability maliciously exploited before a patch was publicly available. Its annual review combines detected and disclosed cases, and its reporting-year treatment follows its own methodology. The unit is a distinct vulnerability: repeated attacks using the same flaw do not add to the total, while separate flaws in an exploit chain can count separately (GTIG annual review).
The forecast date is November 5, 2026, but the latest comparable aggregate covers only January–August. The interim analysis was published on September 30, 2026, rather than in October (interim analysis). The outcome will come from the first qualifying dedicated annual review released by August 31, 2027. Later revisions will not change it. If no qualifying review appears by that deadline, the question is annulled; the numerical forecast is conditional on publication.
Evidence
The historical backbone is a short, variable series. GTIG’s March 2026 historical chart reports 96 zero-days for 2021, 63 for 2022, 100 for 2023, 78 for 2024 and 90 for 2025. These are all figures from the same publication vintage, rather than each year’s original headline. They establish a recent range without showing a steady upward trend (historical annual chart).
Publication vintage matters. The April 29, 2025 review initially reported 75 for 2024 and 98 for 2023. Those became 78 and 100 in the March 5, 2026 review. This is direct evidence that the recorded history can change as information and classifications change. It does not establish that revisions always move upward, or that the first 2026 headline will receive any particular adjustment (2024 review; 2025 review).
The current-year evidence is stronger than that historical baseline. GTIG’s interim analysis reports approximately 11 observed zero-days per month during January–August 2026, compared with approximately eight per month in 2025. It also identifies 22 in August 2026. That supports a higher annual count, but the monthly pattern matters more than the rounded average alone (interim analysis).
The table below gives the complete monthly zero-day history available in the interim chart. These are readings of the chart’s integer bar heights, not a separately published underlying data table. A dash means that the chart does not cover that month in 2026, not that no zero-days occurred (monthly chart).
| Month | 2025 zero-days | 2026 zero-days |
|---|---|---|
| January | 9 | 5 |
| February | 8 | 12 |
| March | 14 | 6 |
| April | 11 | 9 |
| May | 9 | 12 |
| June | 6 | 12 |
| July | 6 | 9 |
| August | 5 | 22 |
| September | 9 | — |
| October | 6 | — |
| November | 3 | — |
| December | 8 | — |
The 2026 entries sum to 87 through August. That is already close to the dedicated annual review’s total of 90 for all of 2025. This is the clearest reason not to anchor the forecast near the historical baseline. The partial-year evidence contains substantial information about the eventual total, even though it is not itself the resolving count (monthly chart; 2025 annual review).
August also supplies the strongest reason for restraint. Every earlier 2026 month in the chart was lower. The preceding seven months total 65, so the elevated average partly reflects one unusually large observation. I read this as evidence for continued elevated activity, not proof that the August rate has become normal. The forecast therefore preserves room for both normalization and further acceleration (monthly chart).
A second complication is comparability. The chart’s twelve monthly readings for 2025 total 94, whereas the dedicated annual review reported 90. The evidence does not identify a single explanation. Later discoveries, different inclusion or classification choices, and chart-reading uncertainty remain possible. The interim total is not interchangeable with the annual headline. Nor does this one discrepancy justify automatically subtracting the same amount from 2026 (monthly chart; annual review).
Individual reports show why disclosure timing can complicate the aggregate. GTIG’s October 15 BeyondTrust report describes a vulnerability disclosed in October but exploited since late August. That example separates exploitation timing from disclosure timing. It supports allowing for delayed reporting, but it is not an exhaustive late-year count and should not simply be added to an extrapolated aggregate (BeyondTrust report).
The narrower Project Zero tracker does not settle the missing months. Its coverage is limited to its research targets and excludes some categories. Its relationship to the broader GTIG population is not stable enough to support a fixed scaling factor. Sparse recent entries therefore offer only weak evidence against an end-user surge; they do not establish low activity across enterprise systems or the whole GTIG universe (Project Zero tracker; tracking spreadsheet).
The AI evidence also needs a narrow reading. GTIG’s interim analysis distinguishes zero-day growth from the larger increase in exploitation of already known vulnerabilities. Its later ARTEX report documents agentic frameworks in real intrusions, but the examples prominently involve credentials, known weaknesses and post-compromise activity. Faster attacks and more automation are relevant background. They are not direct measurements of new, distinct exploited zero-days (interim analysis; ARTEX report).
What's non-obvious
The easy mistake is to choose between two simple stories: recent annual totals have been fairly stable, or AI means an explosive increase. Neither captures the evidence. The historical range is already being challenged by the partial-year count. Yet the strongest apparent acceleration includes an exceptional month, while much of the broader exploitation growth concerns known vulnerabilities rather than zero-days. The forecast reflects a higher level of observed activity without treating every cyberattack trend as evidence for this specific count.
The other overlooked point is that the target is a first-publication statistic. More complete knowledge of exploitation does not necessarily produce the same number as the first annual headline. Retrospective revisions show that the recorded history evolves, while the interim-versus-annual discrepancy shows that adjacent official datasets need not reconcile exactly. The uncertainty is therefore about both the remaining vulnerabilities and how GTIG classifies and reports them.
Uncertainties
The largest gap is the absence of a comprehensive comparable GTIG aggregate after August. September and October had elapsed by the forecast date, but they were not fully measured in the available series. A complete September–December breakdown on the same basis would distinguish a temporary August spike from a sustained change in pace.
The second gap is the unexplained difference between the interim chart and the dedicated annual review. An official reconciliation, underlying chart data or a clear statement of inclusion changes would reduce this uncertainty. Until then, both upward and downward differences remain possible. The observed subtotal should not be treated as an immutable floor for the final headline.
Late disclosures and investigations add uncertainty even after the calendar year ends. So do changes in methodology or reporting-year classification. The available evidence does not establish the size or direction of those effects. These uncertainties explain the spread between the saved percentiles; they do not change the saved forecast.
Forecast history
| Date | Forecast |
|---|---|
| Median 128, 80% range 110 to 151 |
Sources Prolepsia read
- https://cloud.google.com/blog/topics/threat-intelligence/2025-zero-day-reviewcloud.google.com
- https://storage.googleapis.com/gweb-cloudblog-publish/images/zero-day-2025-fig1a.max-1700x1700.jpgstorage.googleapis.com
- https://projectzero.google/0day.htmlprojectzero.google
- https://docs.google.com/spreadsheets/d/1lkNJ0uQwbeC1ZTRrxdtuPLCIl7mlUreoKfSIgajnSyYdocs.google.com
The question
This question asks how many distinct zero-day vulnerabilities exploited in the wild Google Threat Intelligence Group (GTIG) will report for calendar year 2026 (January 1 through December 31, 2026) in its annual review of zero-day exploitation, expected to be published in 2027. The forecast target is the headline annual total reported by GTIG, rather than an independent estimate of all zero-day exploitation worldwide. GTIG publishes annual analyses combining Google's threat intelligence research, Mandiant investigations, and reliable external reporting. GTIG defines a zero-day as a vulnerability maliciously exploited in the wild before a patch was publicly available. Its counts cover detected and disclosed vulnerabilities and therefore do not necessarily represent the full extent of zero-day exploitation. Historical annual reviews provide useful benchmarks. GTIG's April 29, 2025 review initially reported 75 zero-day vulnerabilities exploited in 2024, compared with 98 in 2023 and 63 in 2022. Its subsequent review, published March 5, 2026, revised those historical figures upward, reporting 78 for 2024 and 100 for 2023. Most importantly, the March 2026 review reported 90 zero-day vulnerabilities exploited in 2025. GTIG described annual counts as having stabilized within a range of approximately 60–100 vulnerabilities over the preceding several years. Sources: https://cloud.google.com/blog/topics/threat-intelligence/2024-zero-day-trends and https://cloud.google.com/blog/topics/threat-intelligence/2025-zero-day-review. ([cloud.google.com](https://cloud.google.com/blog/topics/threat-intelligence/2025-zero-day-review)) More recent information suggests that 2026 could exceed those historical totals. In an October 2026 analysis, GTIG reported that its observed zero-day exploitation count averaged approximately 11 vulnerabilities per month from January through August 2026, compared with approximately eight per month in 2025. It also reported an unusually high count of 22 in August 2026. These preliminary figures provide context but are not necessarily directly comparable with the eventual annual review total, which may use different inclusion criteria or incorporate subsequent discoveries and revisions. Source: https://cloud.google.com/blog/topics/threat-intelligence/vulnerability-discovery-and-exploitation-trends-in-the-ai-era. ([cloud.google.com](https://cloud.google.com/blog/topics/threat-intelligence/vulnerability-discovery-and-exploitation-trends-in-the-ai-era?e=0&hl=en)) As of November 5, 2026, the reporting year is not yet complete. The question will resolve using GTIG's dedicated annual review covering 2026, provided that it is publicly released by August 31, 2027.
How it resolves
The outcome will be the integer number of distinct zero-day vulnerabilities exploited in the wild during 2026 that Google Threat Intelligence Group reports as its overall annual total in its dedicated 2026 zero-day review, expected to be published in 2027. The primary resolution source will be GTIG's official annual zero-day exploitation review published on the Google Cloud Threat Intelligence blog or an equivalent official Google publication. The relevant number is the overall count of exploited zero-day vulnerabilities reported for 2026, typically presented in the executive summary and numerical analysis sections of the review. If the review includes a chart or table showing historical annual counts, the explicitly stated 2026 annual total in the accompanying text takes precedence. The outcome will be based on the first publicly published version of the dedicated annual review that provides an explicit 2026 total. Later corrections or revisions to the 2026 figure, including revisions appearing in subsequent annual reviews, will not change the resolved outcome. If the initial publication contains conflicting 2026 totals, an explicit correction issued by GTIG before the resolution deadline will be used. Otherwise, the question will be annulled if the conflict prevents identification of a single authoritative total. GTIG's methodology and inclusion criteria will govern which vulnerabilities count. In particular, vulnerabilities must satisfy GTIG's definition of exploitation as a zero-day. The total counts distinct vulnerabilities rather than exploitation incidents, threat actors, affected organizations, or attacks. Multiple exploitations of the same vulnerability do not increase the count, while multiple distinct vulnerabilities used together in an exploit chain may be counted separately if GTIG includes them in its total. The forecast will use GTIG's own classification of vulnerabilities by reporting year. In previous reviews, GTIG has described its annual totals in terms of vulnerabilities disclosed during the relevant calendar year and exploited as zero-days. Accordingly, the 2026 total will follow GTIG's annual reporting methodology rather than independently assigning vulnerabilities to years based solely on their earliest known exploitation dates. If GTIG publishes its 2026 annual review under a different title or through a different official Google channel, that publication will qualify provided it clearly constitutes the annual review and explicitly reports the overall 2026 total. If GTIG publishes multiple reports about zero-day exploitation during 2026, the dedicated annual review will take precedence over interim analyses, monthly statistics, individual vulnerability reports, and third-party compilations. A preliminary or partial-year count cannot be substituted for the annual total. If GTIG does not publicly release a qualifying annual review with an identifiable overall 2026 count by August 31, 2027, inclusive, the question will be annulled rather than resolved to zero or estimated from alternative sources. A review published after that deadline will not be used. The deadline is assessed according to the publication date displayed by Google, with August 31, 2027 included.
Fine print
The question measures the number of zero-day vulnerabilities tracked and reported by GTIG, not the actual worldwide number of vulnerabilities exploited as zero-days. Undetected, undisclosed, or otherwise excluded vulnerabilities do not count unless GTIG includes them in its annual total. Historical annual figures are subject to retrospective revision. For example, GTIG's March 2026 report increased the previously published 2024 count from 75 to 78 and the 2023 count from 98 to 100. The first-publication rule is intended to prevent subsequent revisions from changing the forecast outcome after resolution. GTIG may adjust its methodology, vulnerability classifications, or reporting practices between years. The question will accept the methodology used in its qualifying 2026 annual review rather than impose historical criteria independently. If the review presents a clear overall headline count, that count will be authoritative even if GTIG changes its treatment of particular vulnerability categories. If Google reorganizes GTIG, changes its name, or transfers responsibility for the annual review to a successor team, a substantially equivalent official Google annual publication will qualify. Reports from other organizations, including CISA, Microsoft, or independent security researchers, will not substitute for the GTIG review. The forecast range of 40 to 180 vulnerabilities is intended to encompass plausible outcomes rather than impose absolute limits. Outcomes below 40 or above 180 remain possible and should be permitted.
More public forecasts
How many vulnerabilities will CISA add to its Known Exploited Vulnerabilities catalog between 1 January and 31 March 2027?
92median
Prolepsia forecast
How many vulnerabilities will CISA add to its Known Exploited Vulnerabilities catalog in calendar year 2027?
388median
Prolepsia forecast
Will the median annual rent on new residential apartment leases registered in Dubai in December 2026 be lower than in October 2026?
57%chance of yes
Prolepsia forecast
Will Google have the best AI model at the end of December 2026?
73%chance of yes
Prolepsia forecast
How many CVE records will NIST's National Vulnerability Database list as published in calendar year 2027?
Prolepsia forecast